Ui Explorer
This feature allows the user to select an area on the interface. The interface explorer can be accessed from the debug page or some activities. To use the interface explorer in your browser, you need to install the Designated Browser Extension (Chrome, Edge, Firefox) for the browser that you use. You can download it from the tools section in the studio or by clicking on this link.
When the interface explorer is opened, we are asked to select the information of the interface we want to receive by clicking on the inspect button in the upper left corner. Our mouse icon becomes as shown in the picture.

A structure like the one below is formed when we click on the interface.
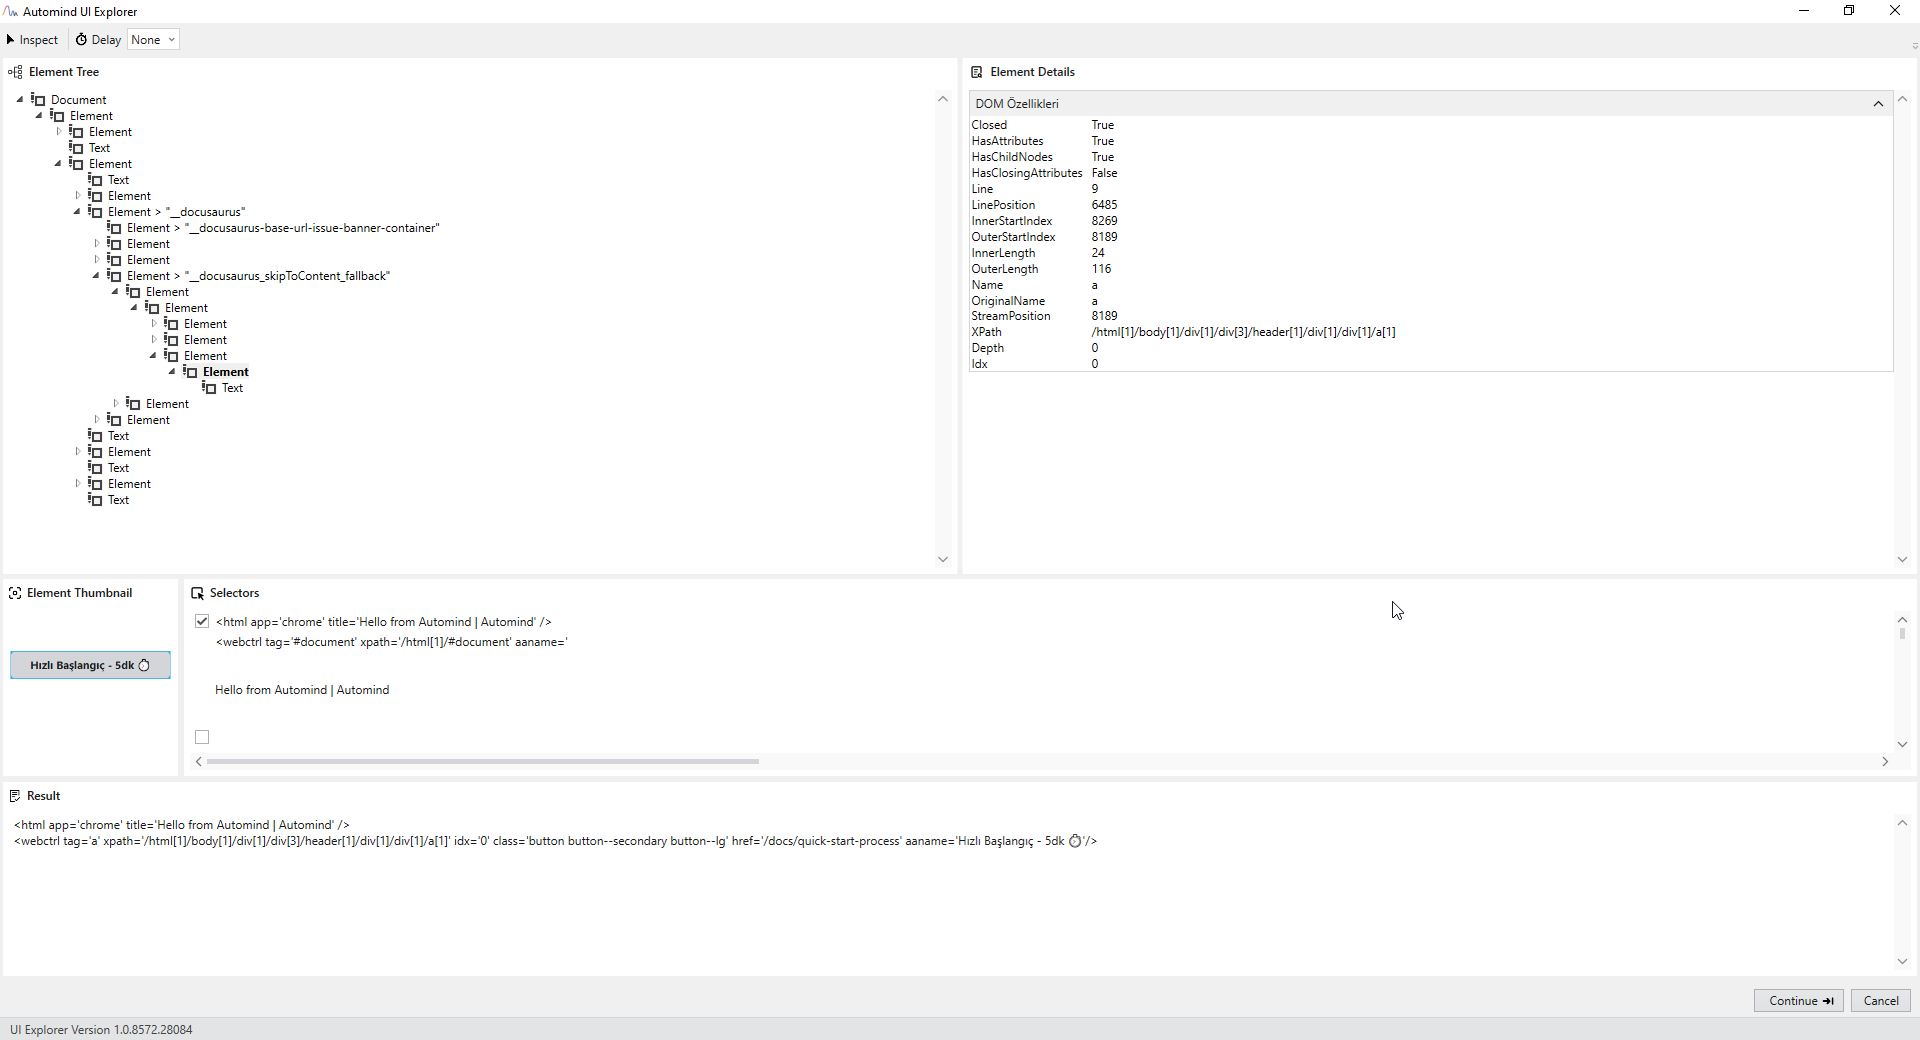
As shown above, a tree structure is displayed in the upper left corner. Here, we can understand where the selected area is located and the appropriate element can be selected from here in case of wrong selections. On the upper right side, it shows the properties of the selected element. The Element Thumbnail contains a photo of the element we selected. In the Selectors section, the xpath structure of the element is extracted, and by default, the first and last values are taken. The output section can be changed here.